
Know what's slow in your Rails app. So does your coding agent.
Rails Pulse is an open source Rails engine that monitors response times, SQL queries, background jobs, and unhandled exceptions, and tells you what to care about. Its built-in MCP server gives Claude Code, Codex and Cursor the same data, so your agent can go from "checkout got slow" to the query and the line of code behind it. Your data stays in your own database.
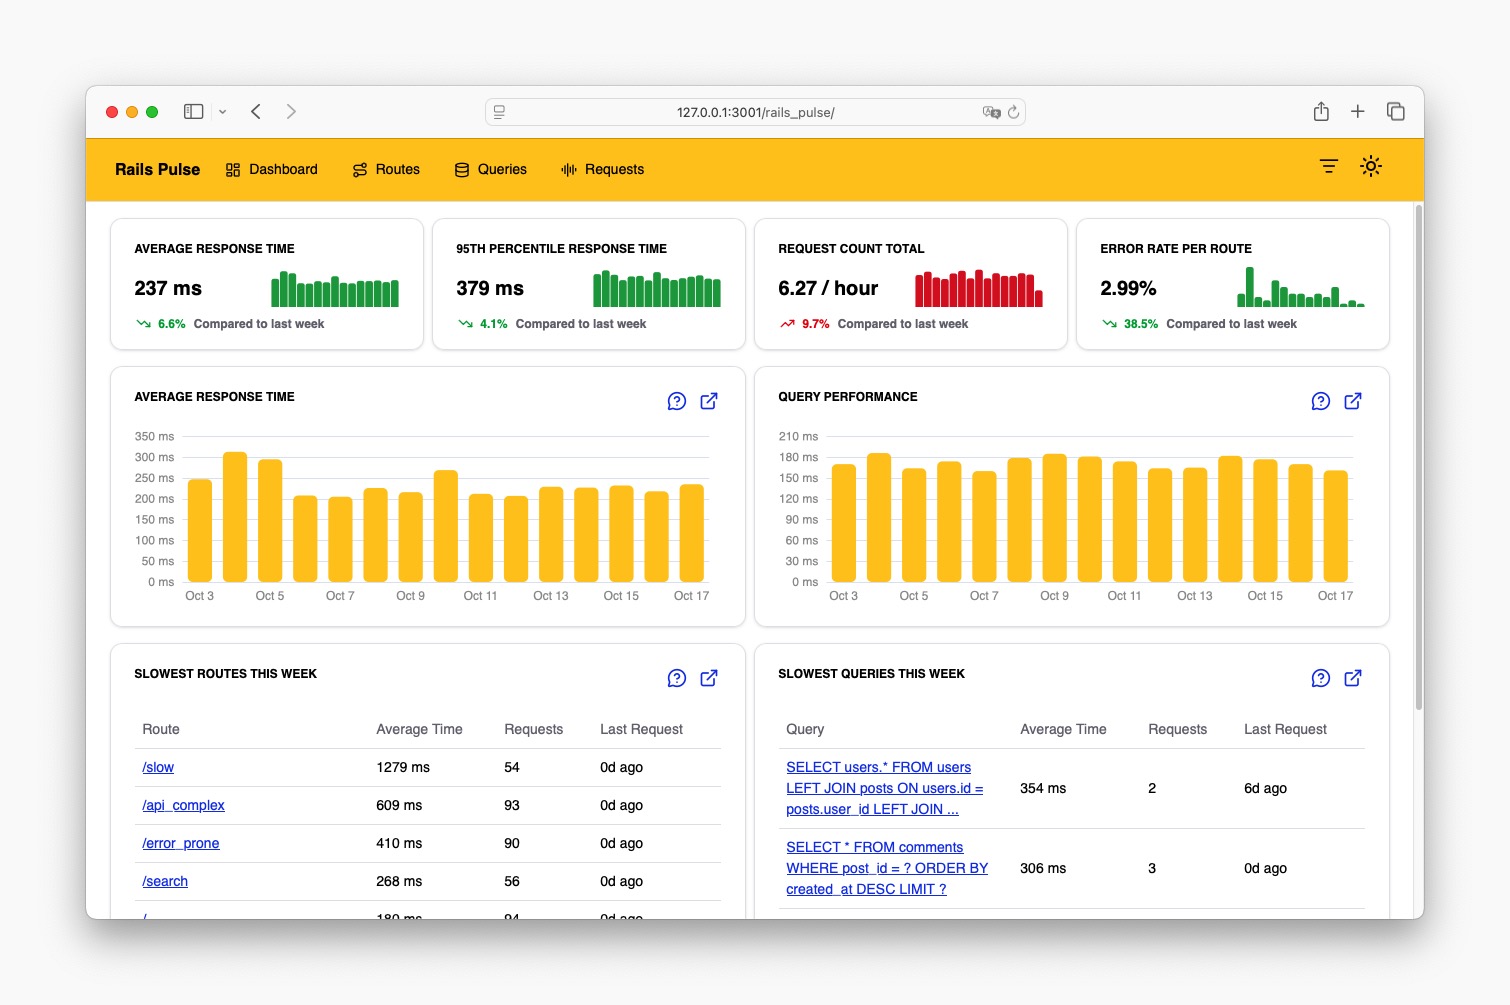
Built for the way you work now: with a coding agent.
Your agent can read your code, but it has never been able to see how that code behaves in production. Rails Pulse closes that gap. Connect it once and your agent can investigate slow endpoints, N+1 queries, failing jobs and exceptions on its own, using real data instead of guesses.
Ten read-only tools, connected in a minute
Routes, slow requests, errors, exceptions with backtraces, one endpoint in depth, expensive and N+1 queries, job health, deployments, and what has actually been recorded.
# Example session
> Checkout got slower after yesterday's deploy. Why?

● rails_pulse_deployments
  └ a41c9e2 deployed 14:02
● rails_pulse_slow_requests since: 14:02
  └ CheckoutsController#create  p95 840ms (was 210ms)
● rails_pulse_queries route: 12
  └ SELECT prices.* ... N+1, 31 calls per request
    app/models/cart.rb:48

a41c9e2 added a price lookup per line item in
Cart#total. Preloading prices brings it back to
one query. Want me to make the change?
$ rails-pulse configure
$ claude mcp add rails-pulse -- bundle exec rails-pulse mcp
$ rails-pulse install claudeFrom endpoint to line of code
Every slow endpoint links to the SQL that ran inside it, and every query to the file and line it came from. Pin a window with since and until and your agent can compare before and after a deploy.
Read-only by design
Nothing your agent can call changes production. Its token reads data and is refused everywhere else, so it can't even record a deploy. And the data never leaves your servers for anyone else's.
Knows when it doesn't know
Agents are confidently wrong when data is missing. Rails Pulse reports which app and environment answered, what has been recorded and whether anything was dropped, so "no failures" is never confused with "no data".
Who is Rails Pulse for?
Rails Pulse is built for developers who want real visibility into their application's performance without the overhead of enterprise monitoring tooling.
Solo developers and small Rails teams
You're paying $300–400/month for Sentry or AppSignal and checking performance metrics once a month. Rails Pulse is built specifically for Rails. It tells you what's slow without requiring you to learn a querying language or configure dashboards.
Teams switching off generic APMs
New Relic and Datadog are built for ops teams with a dedicated platform engineer. If you're a Rails developer who wants answers, not dashboards, Rails Pulse is built for how you actually work.
Developers who own their data
You don't want request traces and query patterns sitting on someone else's servers, subject to their retention policies and their terms of service. With Rails Pulse, it stays in your database.
Let's be honest.
Something in your Rails app is slow. You just don't know exactly what, why, or for how long it's been happening. And when you go looking for a monitoring solution, the options aren't great.
Sentry or Honeybadger
Polished error tracking with alerting and integrations. But performance visibility is buried under a querying language most Rails developers don't have time to learn, the bill grows every time you turn on logs or spans, and your exception payloads live on someone else's servers. Easy to end up paying $300–400/month for features you check monthly.
New Relic or Datadog
Genuinely powerful tools built for ops teams with dedicated platform engineers. $300–$500/month for a typical Rails app, usage-based pricing that grows with traffic, and more dashboards than any one developer has time to configure.
Tailing Logs
Free, but you'll spend more time writing grep commands than writing features. No trend analysis. No SQL query breakdown. No way to correlate a slow request with the queries that caused it.
Rolling Your Own
A few days of instrumentation work, a charting library, a data model, a cleanup job... it's a project in itself. And you rebuild it from scratch every time you start a new app.
There's a better option. One that's built for Rails developers and the agents they work with, not platform engineers, and tells you what to care about.
Four things that make Rails Pulse different.
Opinionated by default
Rails Pulse knows what matters for a Rails app. Route-level response times, slow queries, background job health, recurring exceptions, all surfaced automatically without configuring dashboards or learning a query language. Install it and it tells you what's slow and what's breaking.
Open Source
Rails Pulse is MIT licensed. Add it to your Gemfile and it works with no account required, no API keys, and no external services to configure.
Your Data Stays on Your Server
Every request, every SQL query, every job run, every exception, stored in your own database. Nothing is sent to an external service. No vendor API keys. No outbound connections. Even the optional API your coding agent reads from is served by your own app. Your performance data is as private as the rest of your application.
Agent-Ready
A built-in MCP server, a rails-pulse CLI and a read-only JSON API mean your coding agent, your scripts and your CI can all read what the dashboard shows. And because it lives in your database, you can still query it with SQL. No rate limits. No data export fees.
Everything you need to understand your app's performance.
From slow endpoints to N+1 queries, background job failures to unhandled exceptions, and which deploy made things worse. Rails Pulse gives you the full picture in one dashboard.
SQL Query Performance
Track SQL query performance with slow query identification, P95/P99 percentiles, and configurable SLO thresholds. Quickly identify database bottlenecks and optimize your most expensive queries.
Route-Specific Metrics
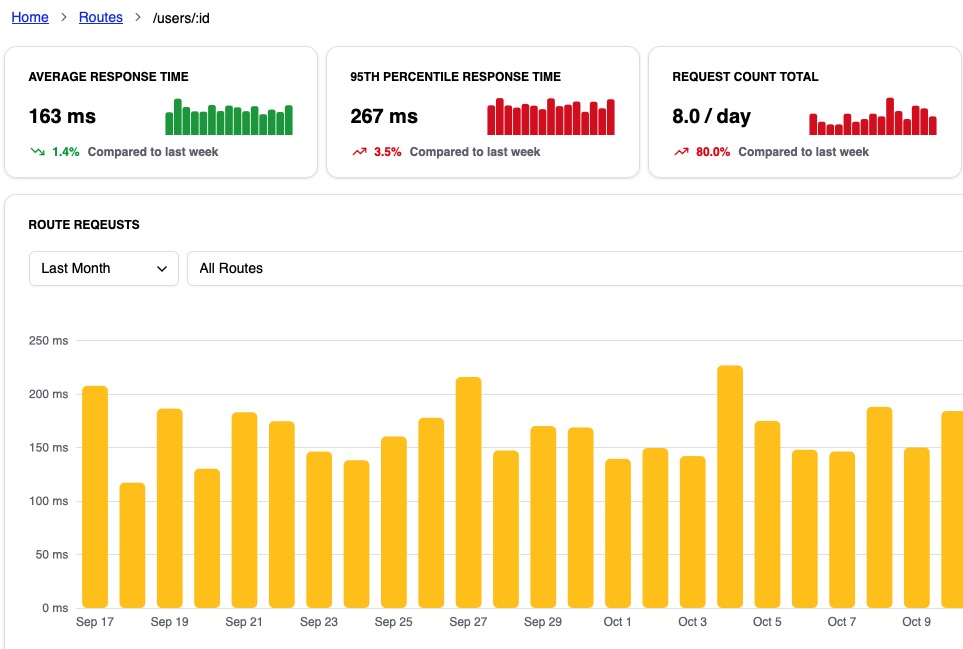
Get granular insights with route-specific metrics and configurable performance thresholds. See exactly which endpoints need optimization.
Exception Tracking
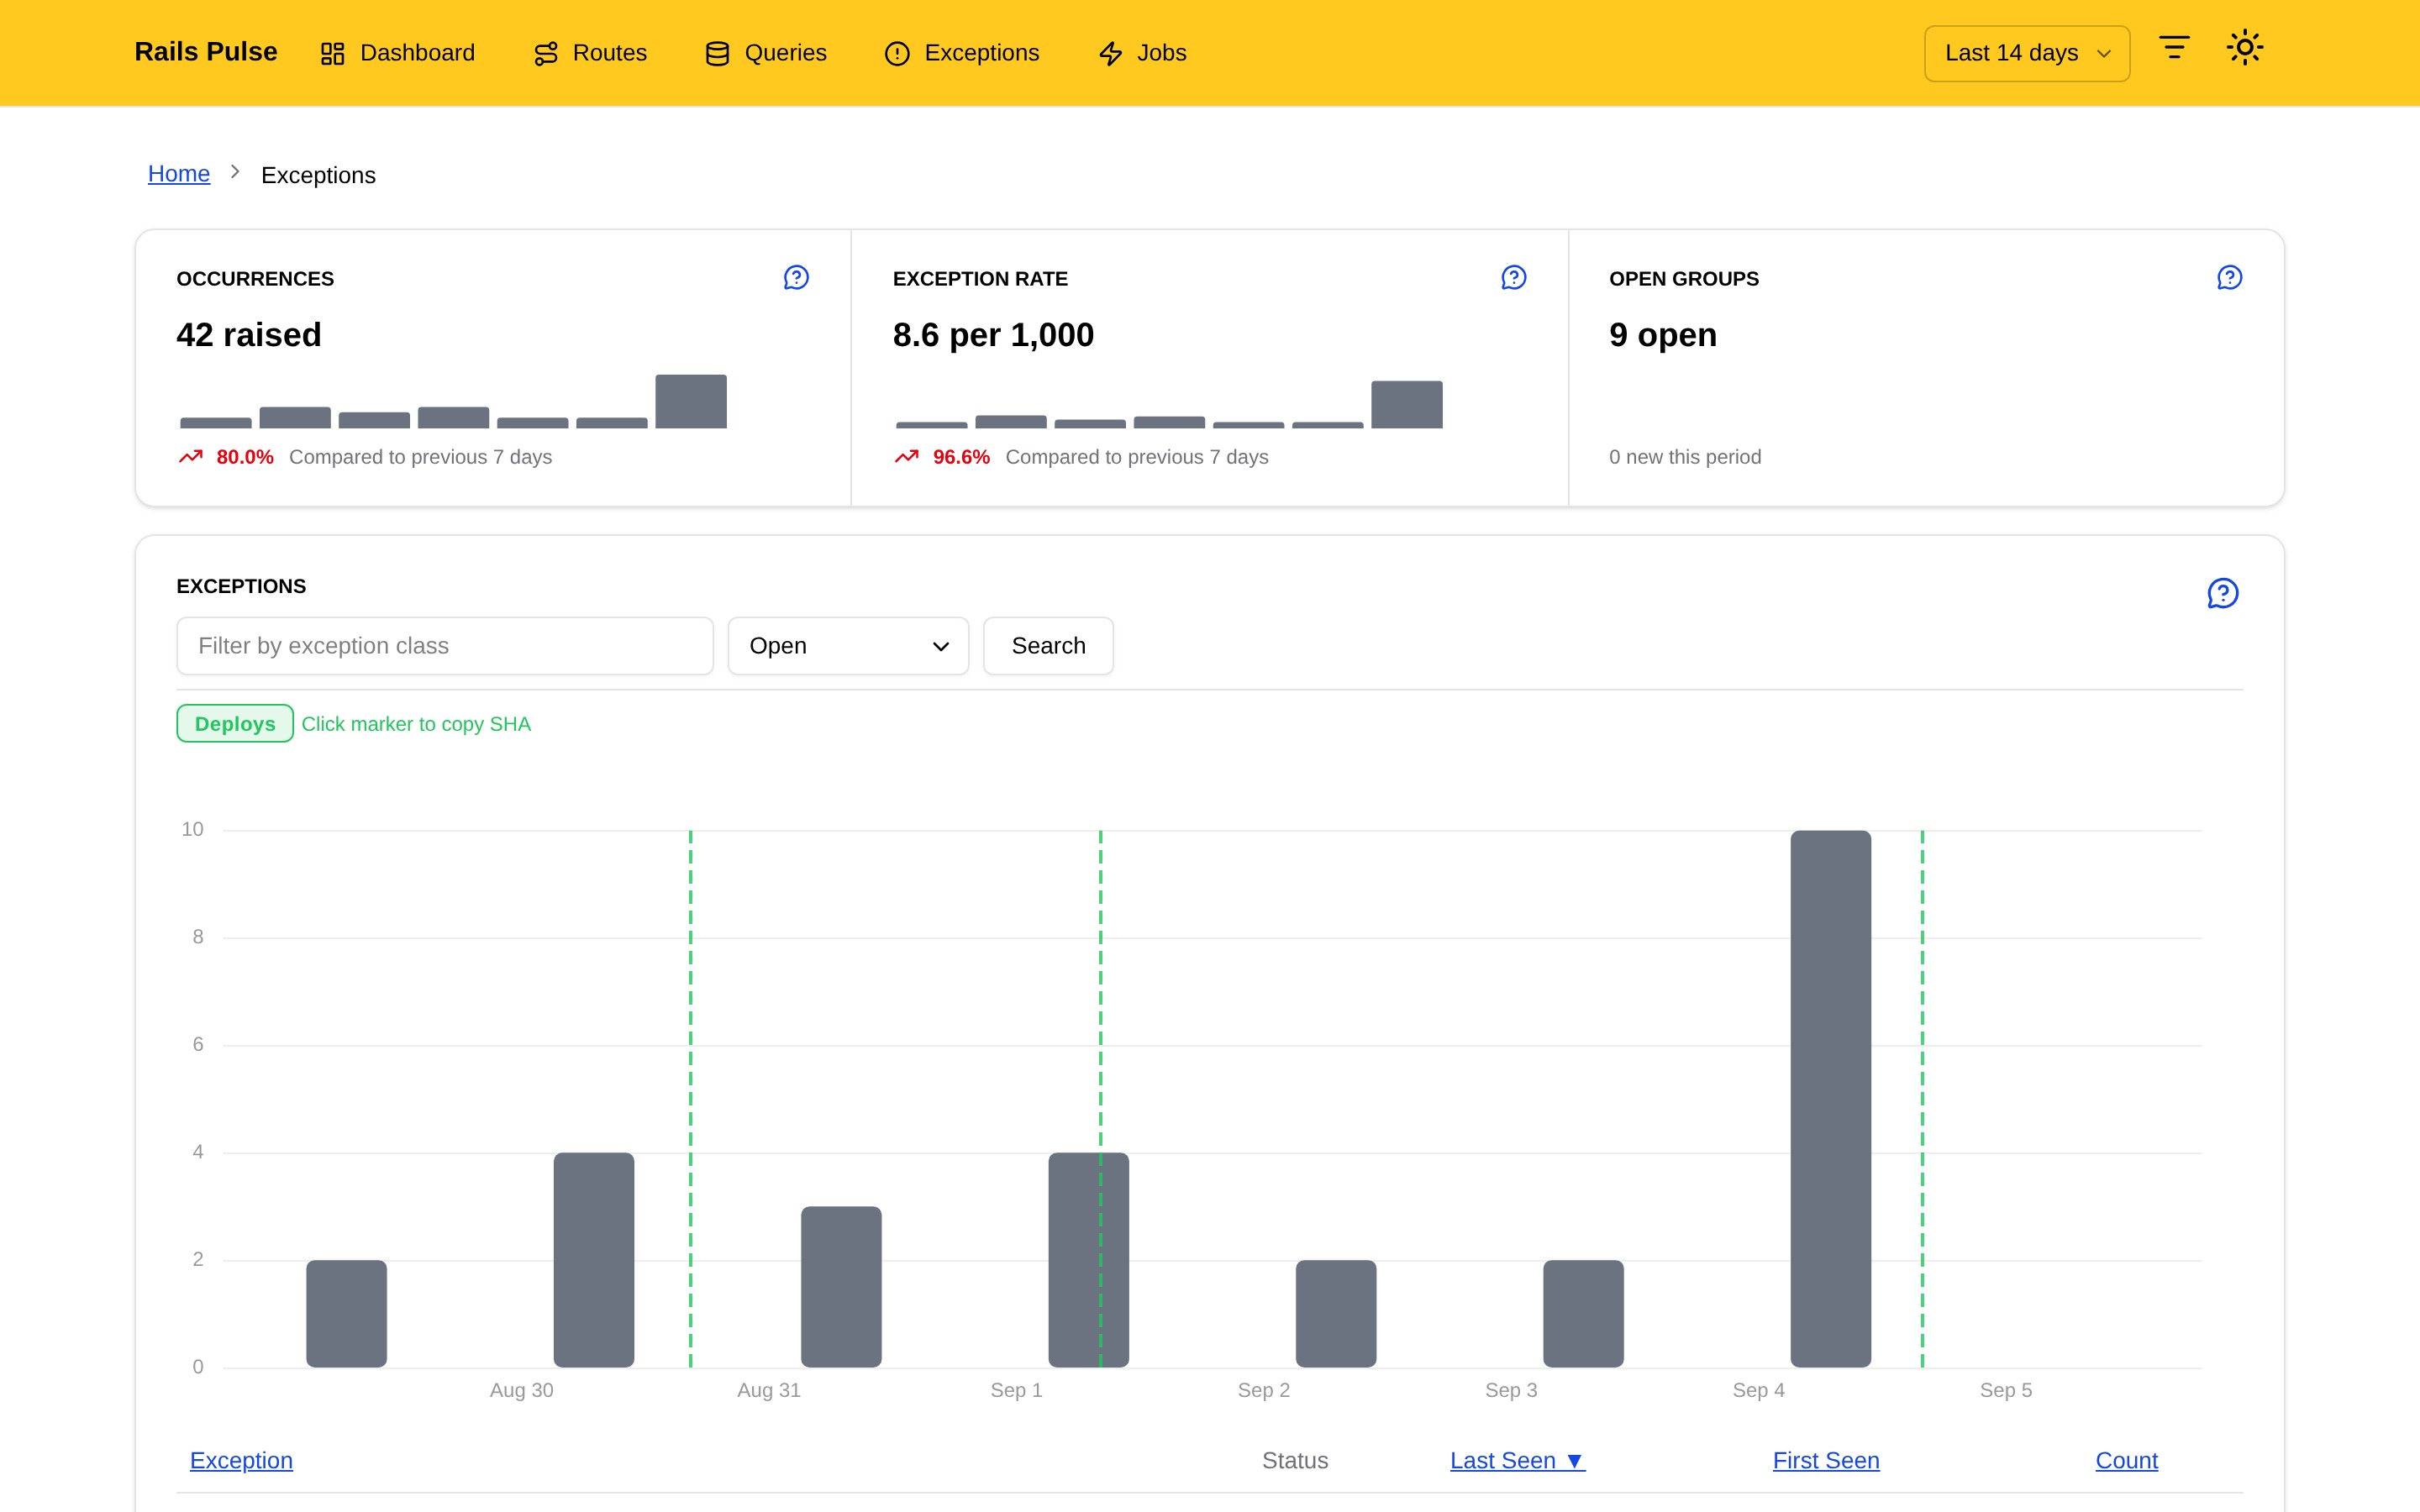
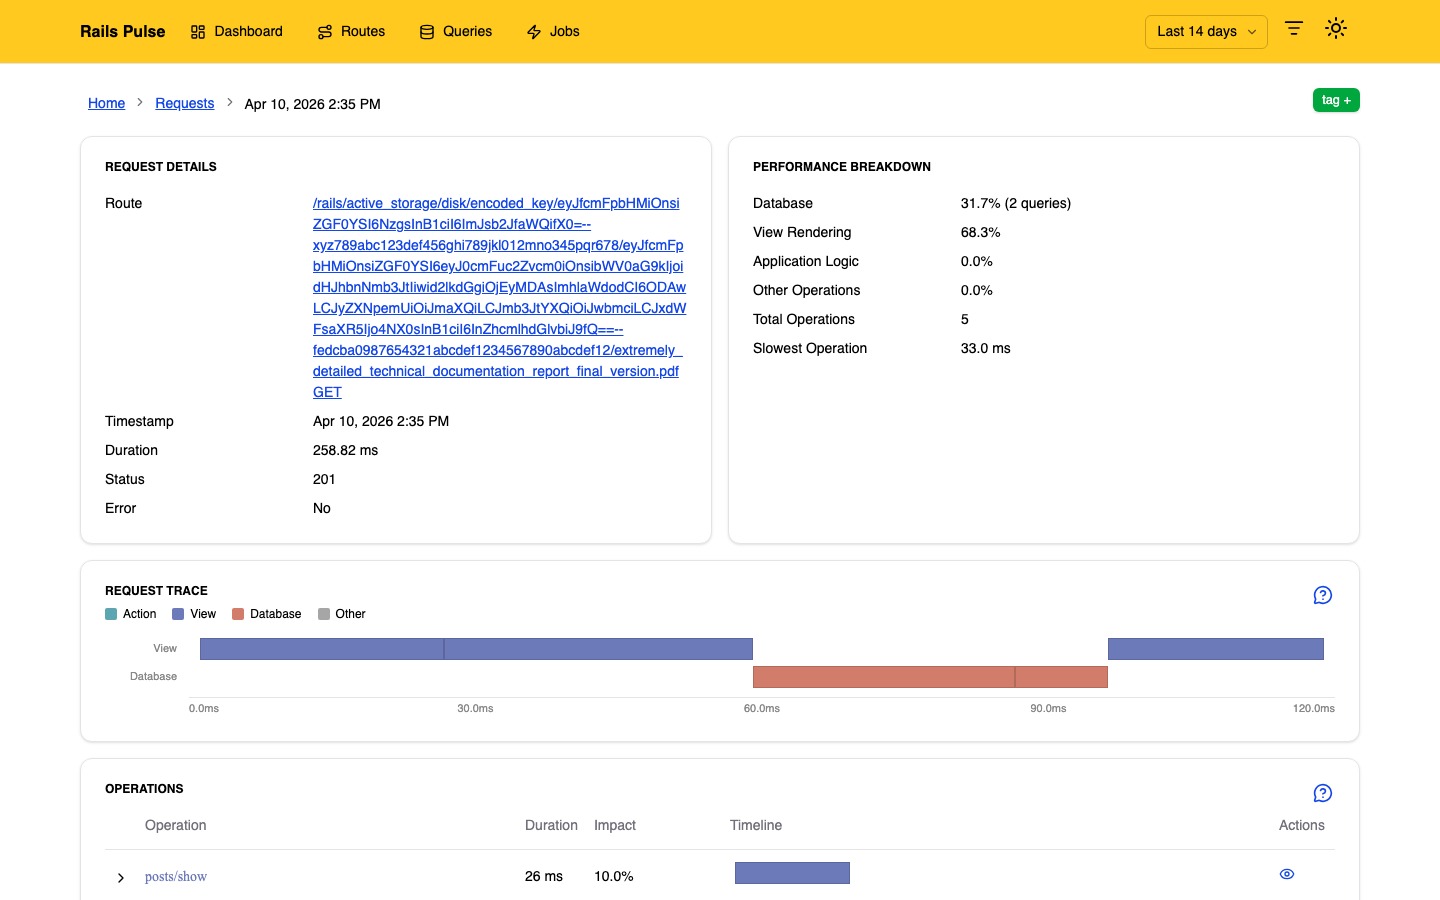
Unhandled exceptions from requests and jobs, grouped by class and location, with backtraces, source context, and filtered params. Messages are redacted with your own filter_parameters before they are stored. Mark them resolved, or copy an LLM-ready summary straight into your editor.
Deployments and What Changed
Record deploys from CI or a rake task and they appear as markers on every chart. Each route, query, and job is compared against its own history, so Rails Pulse tells you not just that something is slow, but that it got slower, and when.
Background Job Monitoring
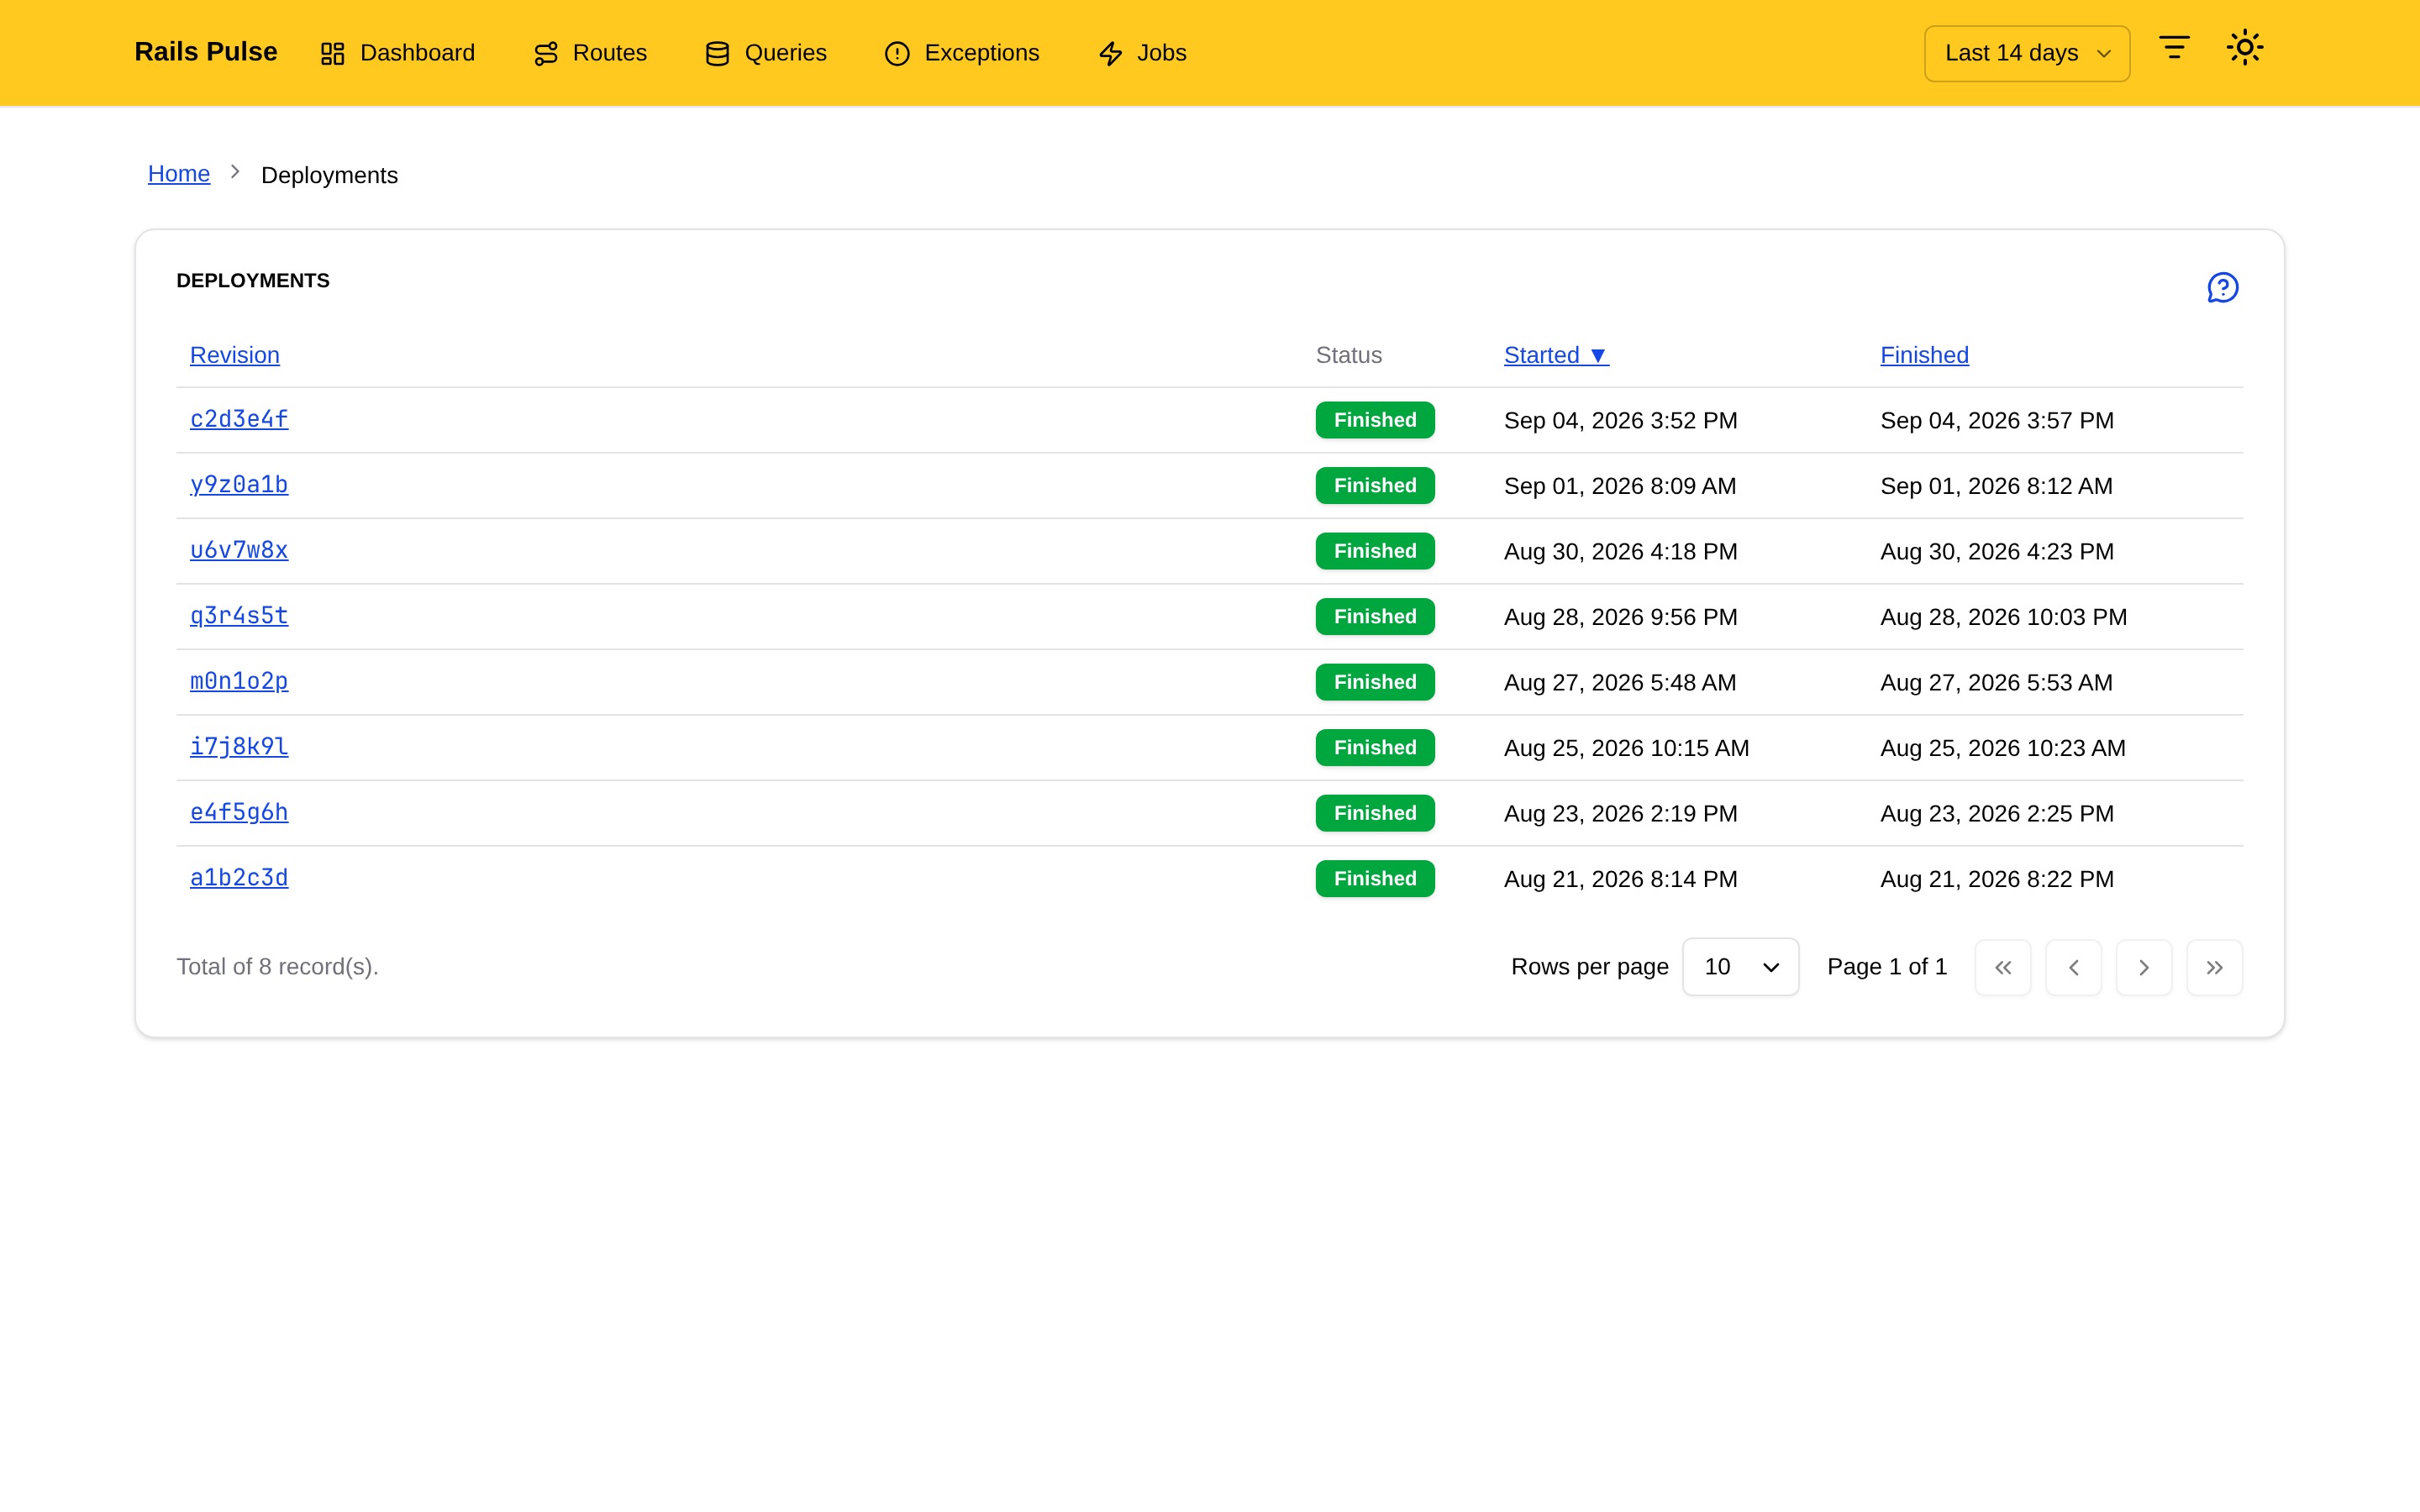
Track job execution time, queue wait, failure rates, and retry counts across all ActiveJob adapters including Sidekiq, Solid Queue, Good Job, and more.
Zero Configuration
Start collecting performance data immediately after installation with sensible defaults. No complex setup required.
Smart Data Cleanup
Automatic data archiving prevents database bloat while preserving essential insights. A storage page shows how full every table is against its cap.
What you can see.
A full dashboard for every layer of your Rails stack: requests, queries, routes, background jobs, exceptions, and deployments, all in one place.
Dashboard
A system health bar across routes, queries, jobs, exceptions, and storage, plus response time percentiles, throughput, errors, recent deploys, and what needs attention right now.
SQL Query Performance
Every SQL query tracked and ranked by execution time, with P95/P99 percentiles and SLO threshold indicators.
Route Metrics
Per-endpoint performance data identified by controller action, with configurable thresholds and a comparison against each route's own history.
Background Jobs
Job execution times, failure rates, retry counts, and queue breakdowns across all your ActiveJob adapters.
Request Detail
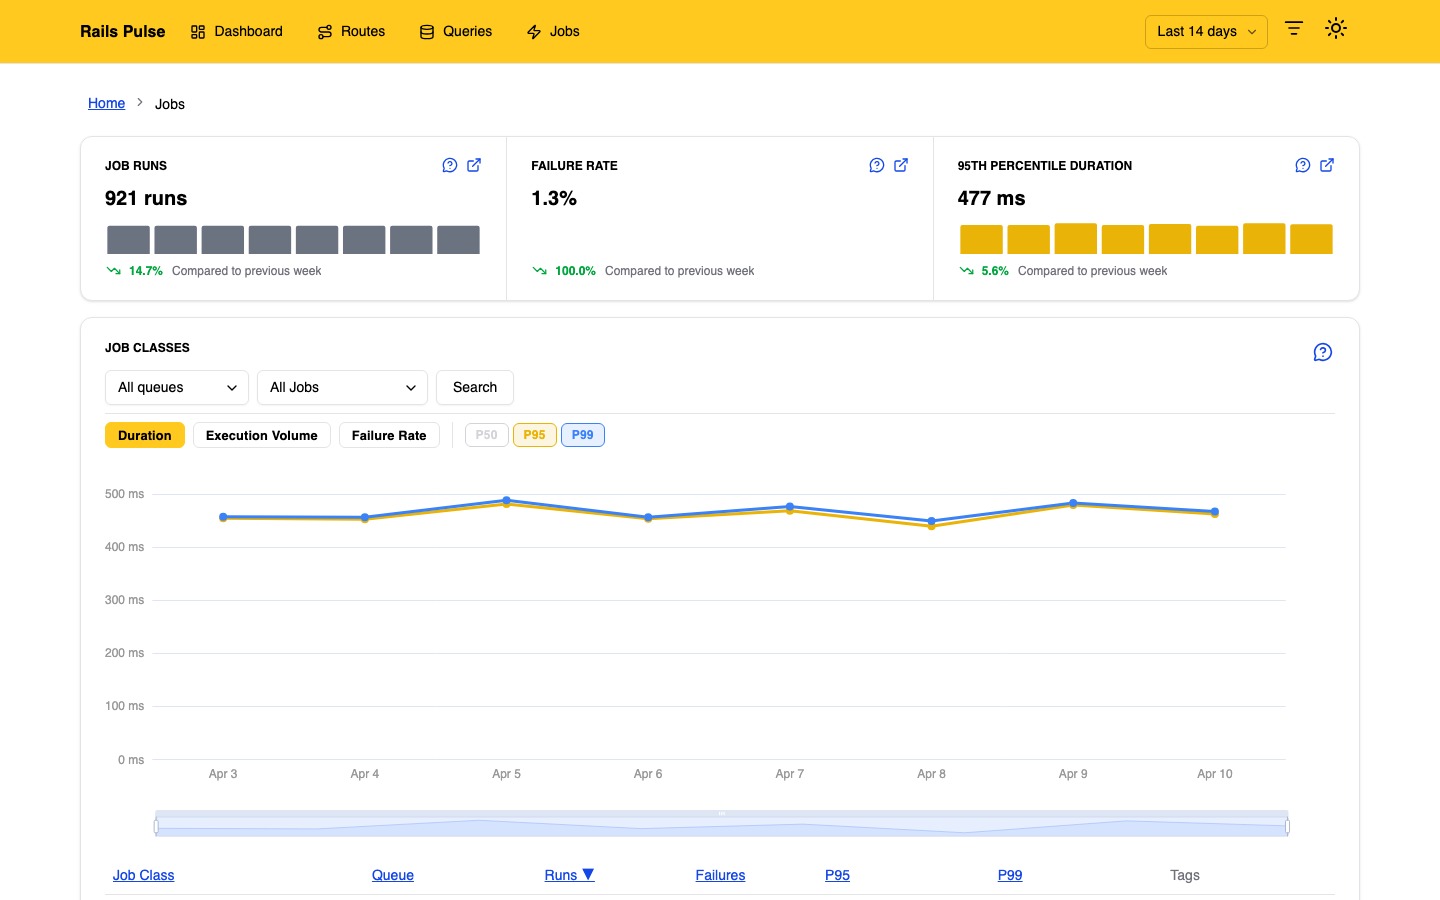
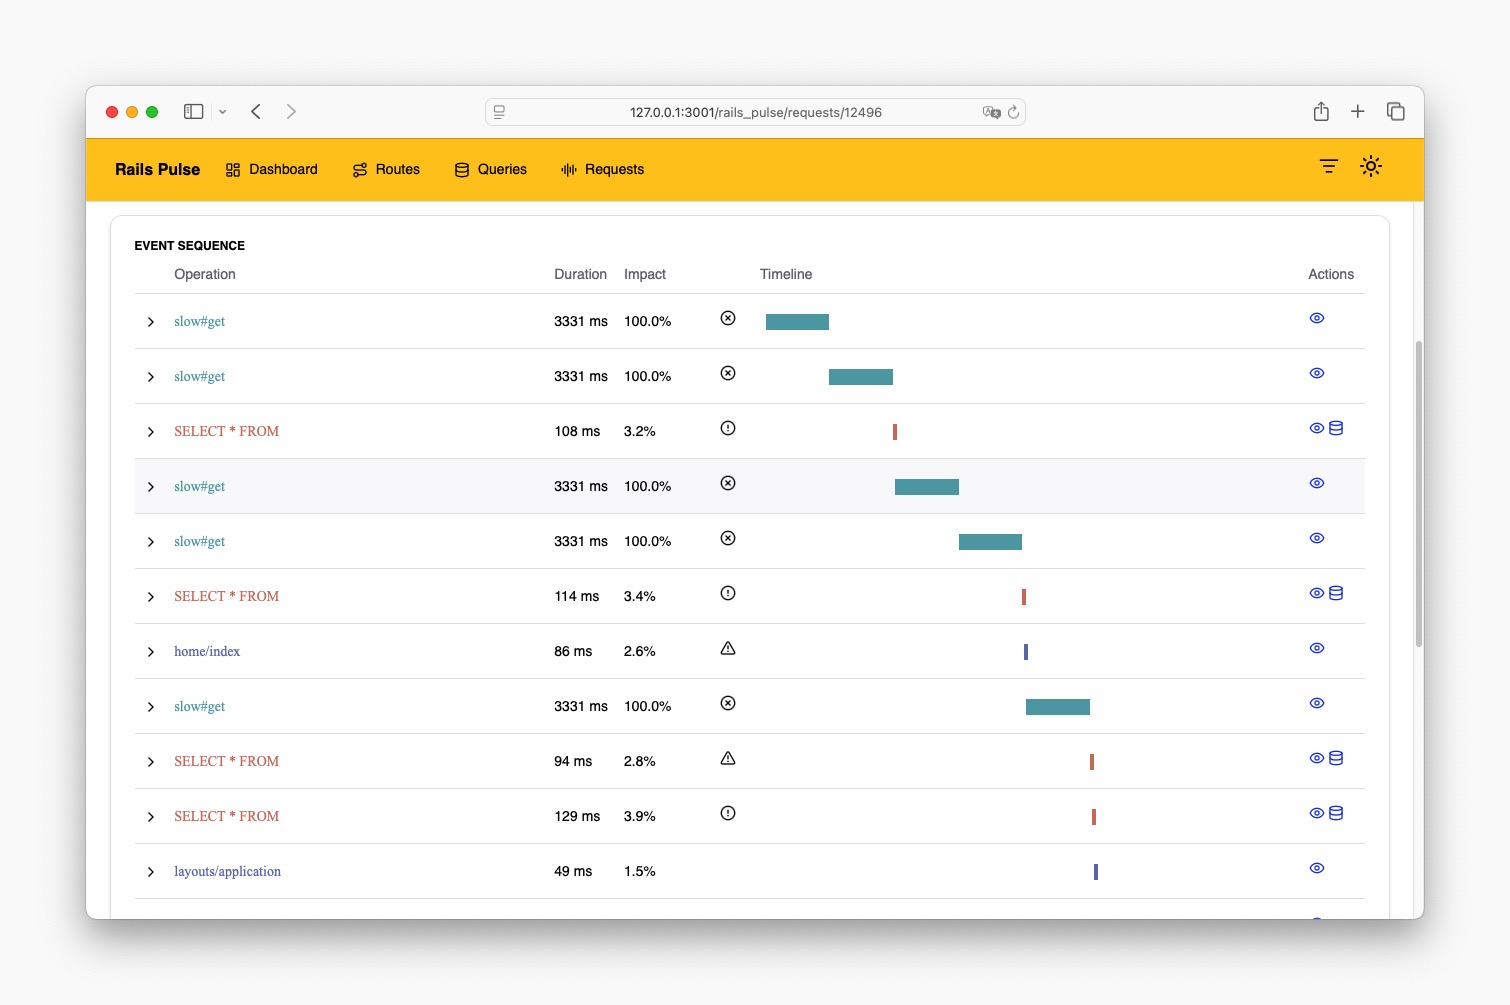
Drill into any request to see every SQL query it triggered, execution time, route, response code, and a full operation timeline. Instantly understand what a slow request was actually doing.
Exception Detail
Every occurrence of an exception with its backtrace, source snippets for your app's frames, filtered request params, and the deploy that was live when it fired.
Storage
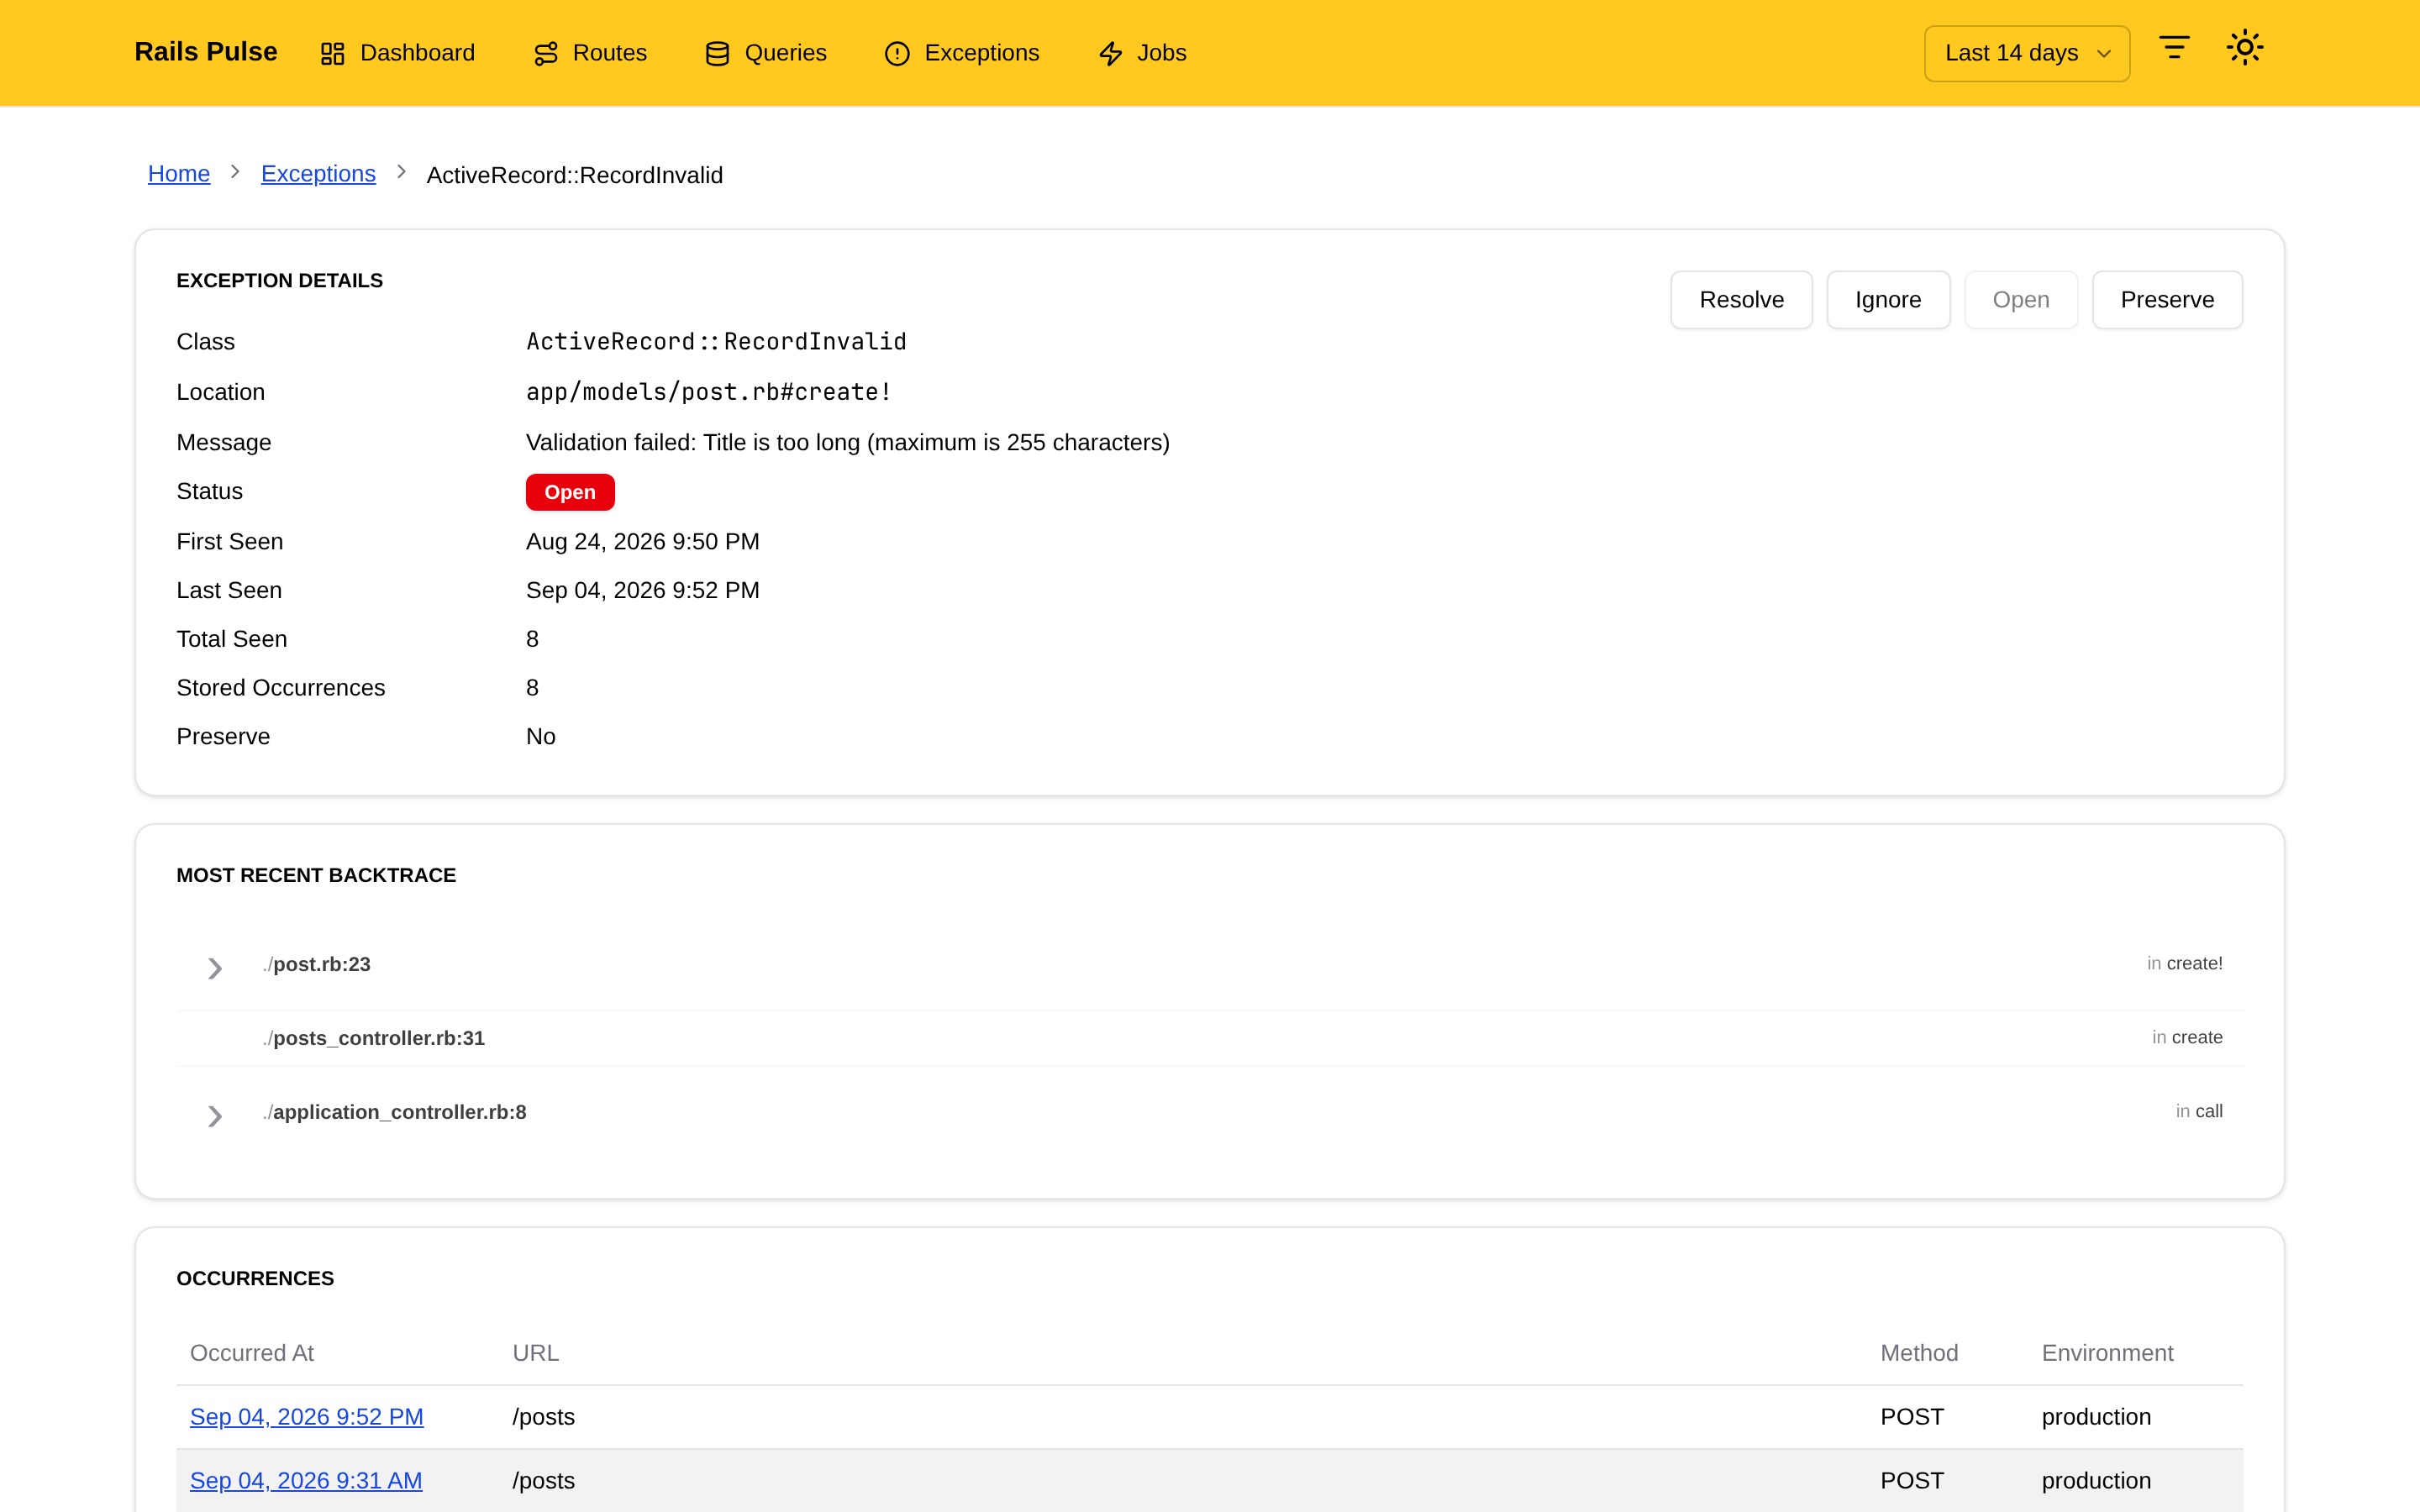
How full each Rails Pulse table is, disk usage, retention settings, and when cleanup last ran. No surprises about what monitoring costs you in database space.
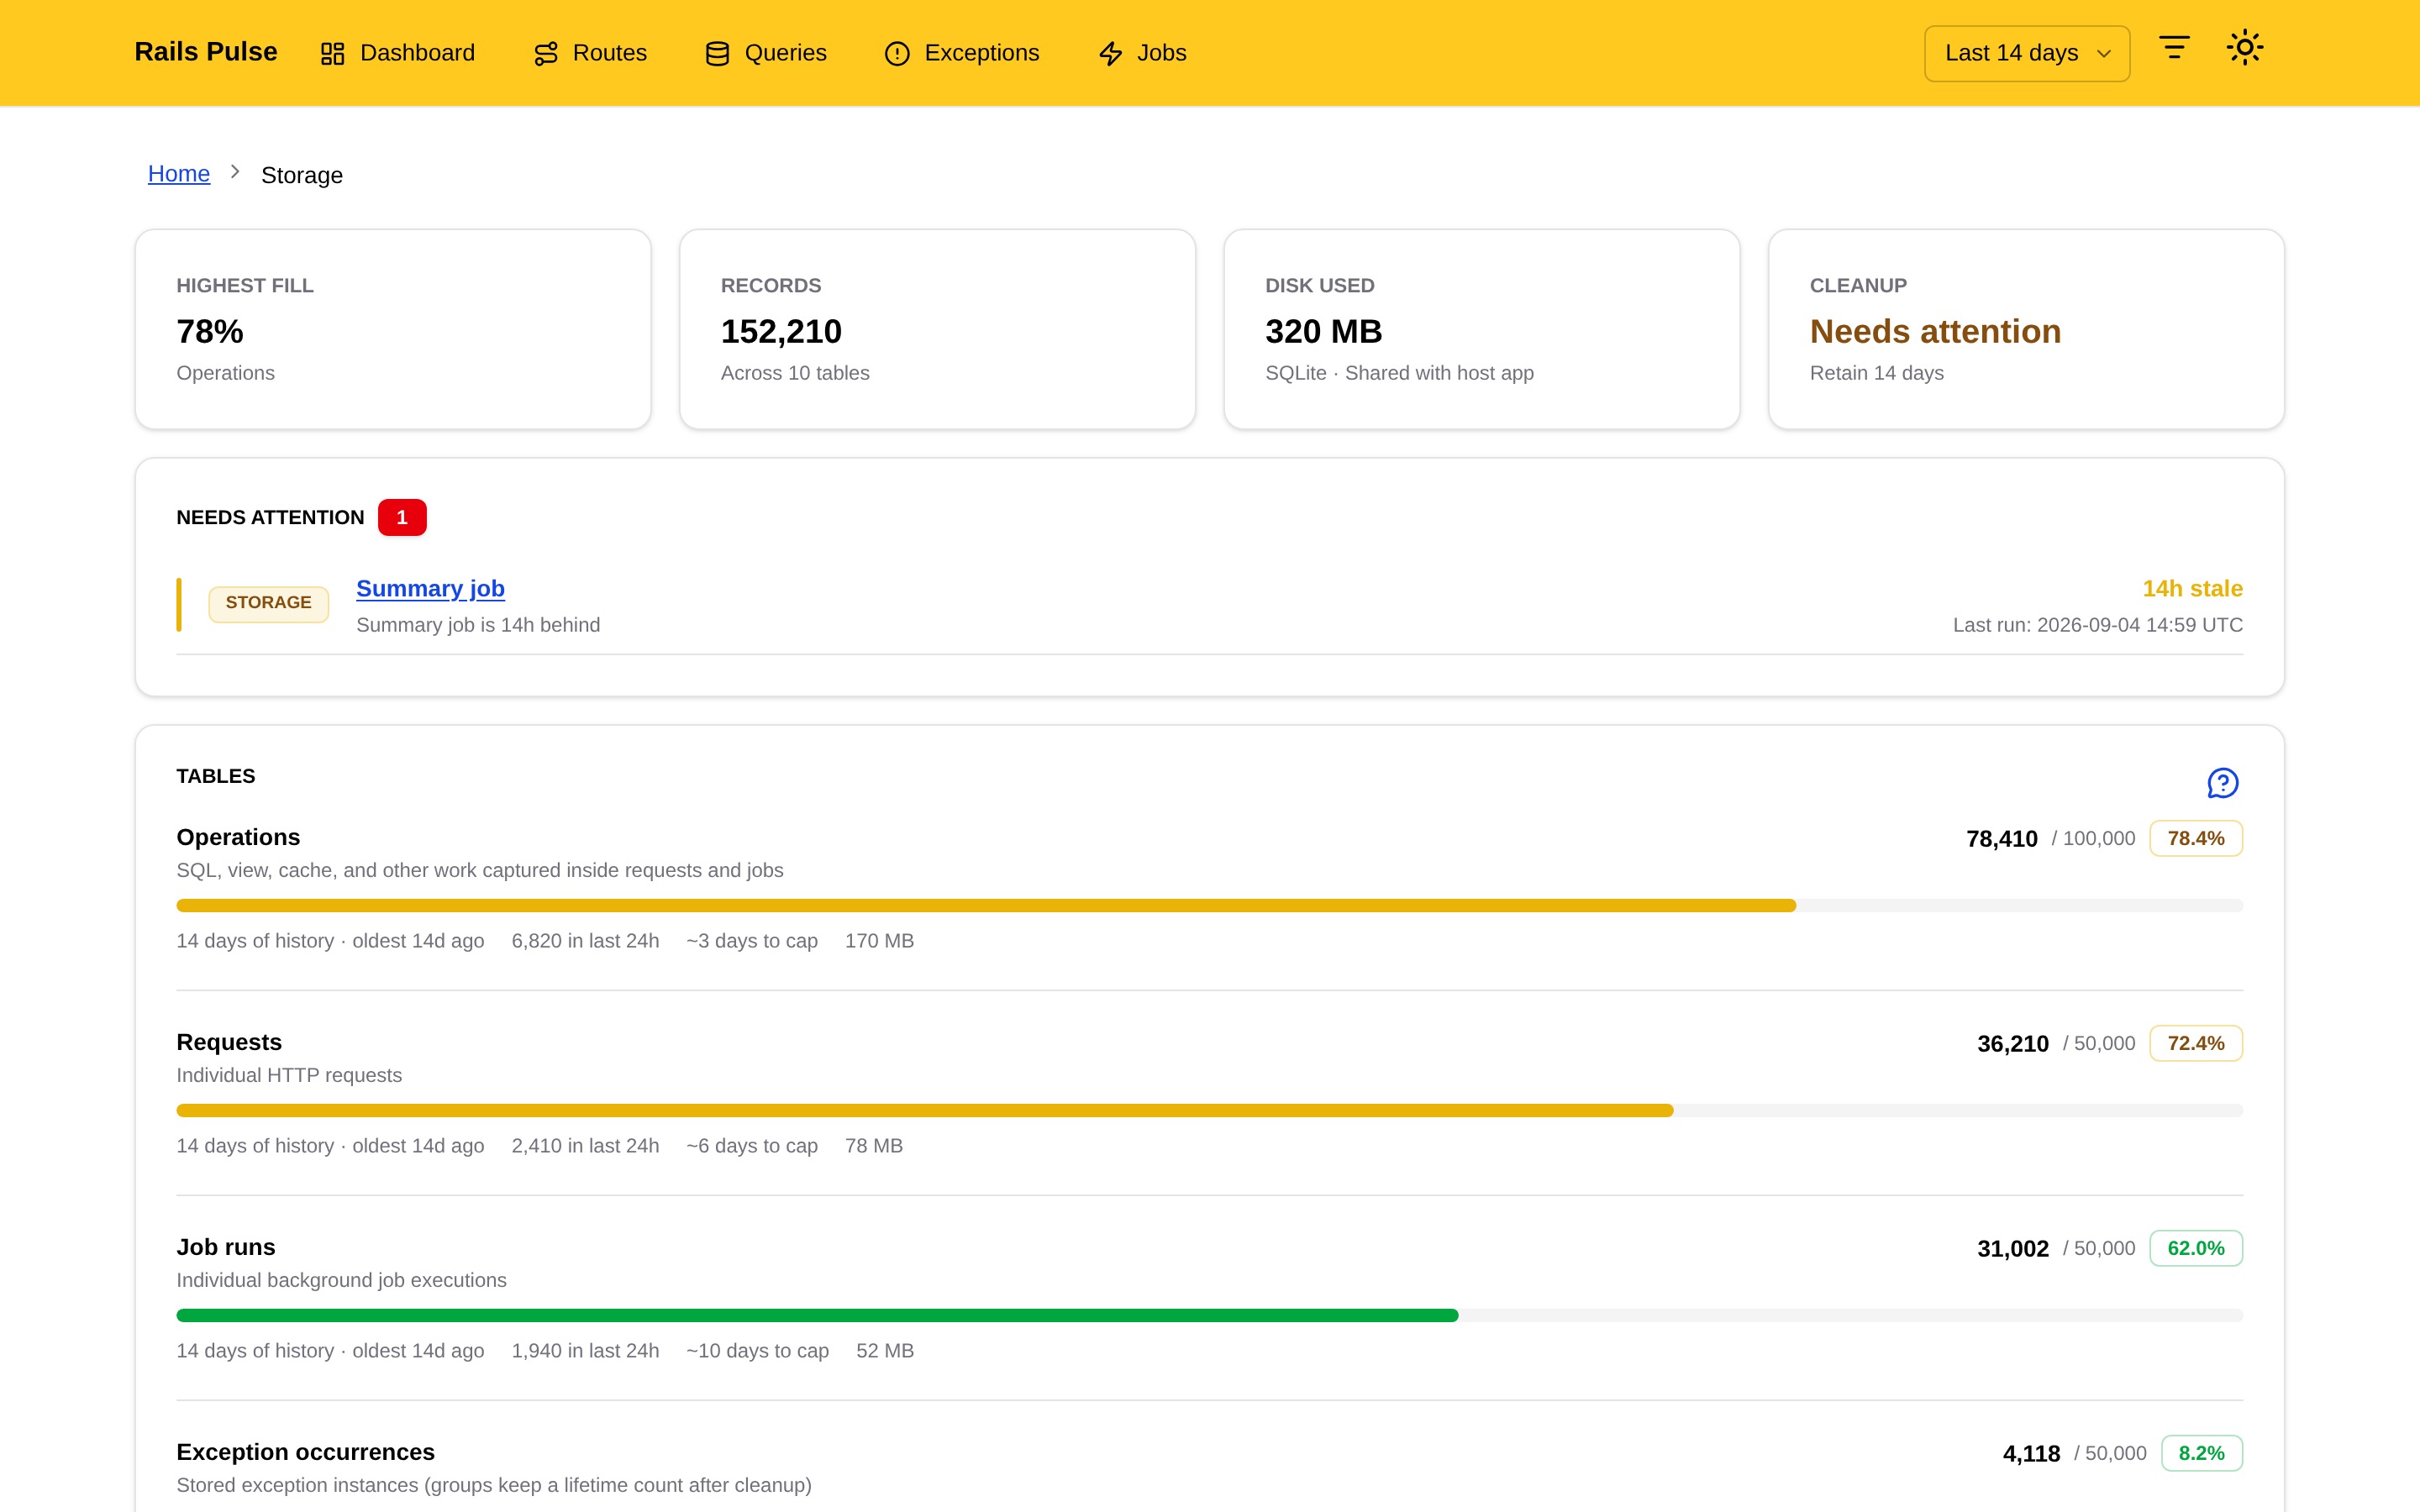
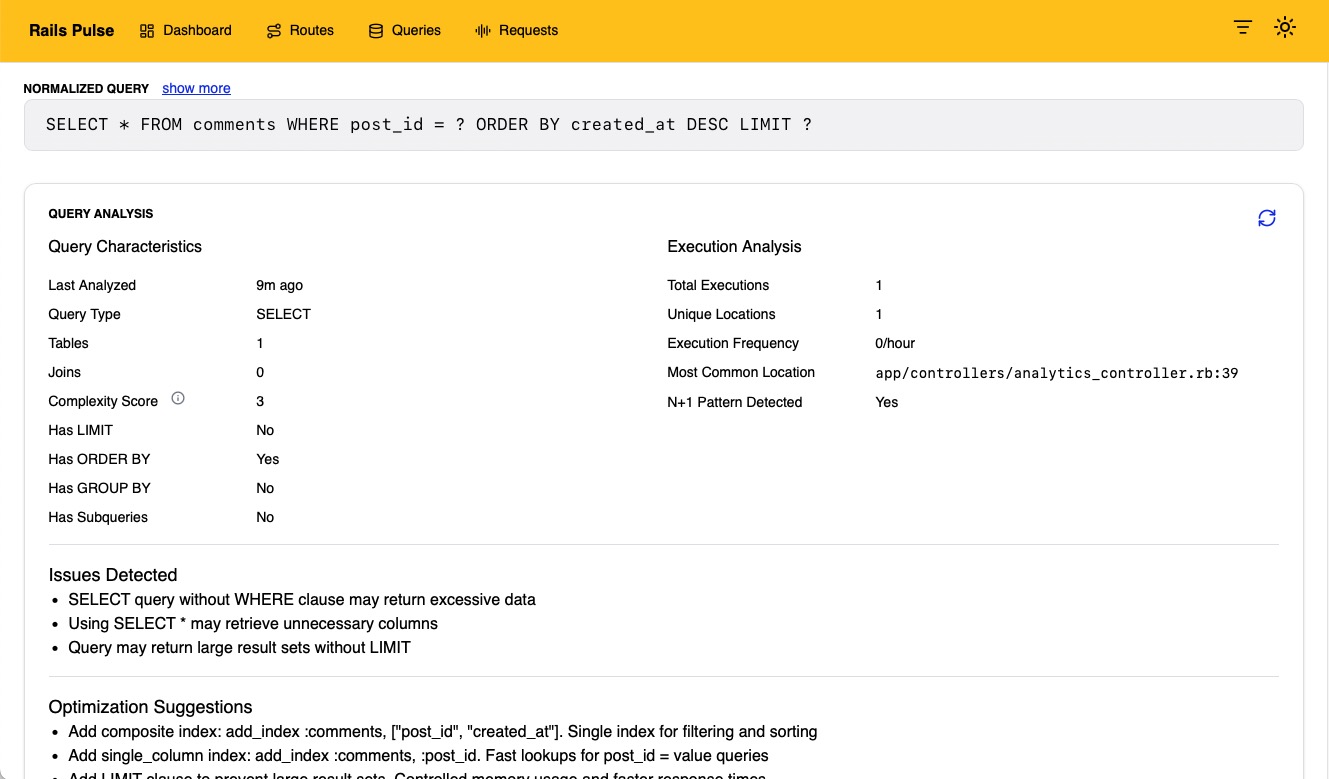
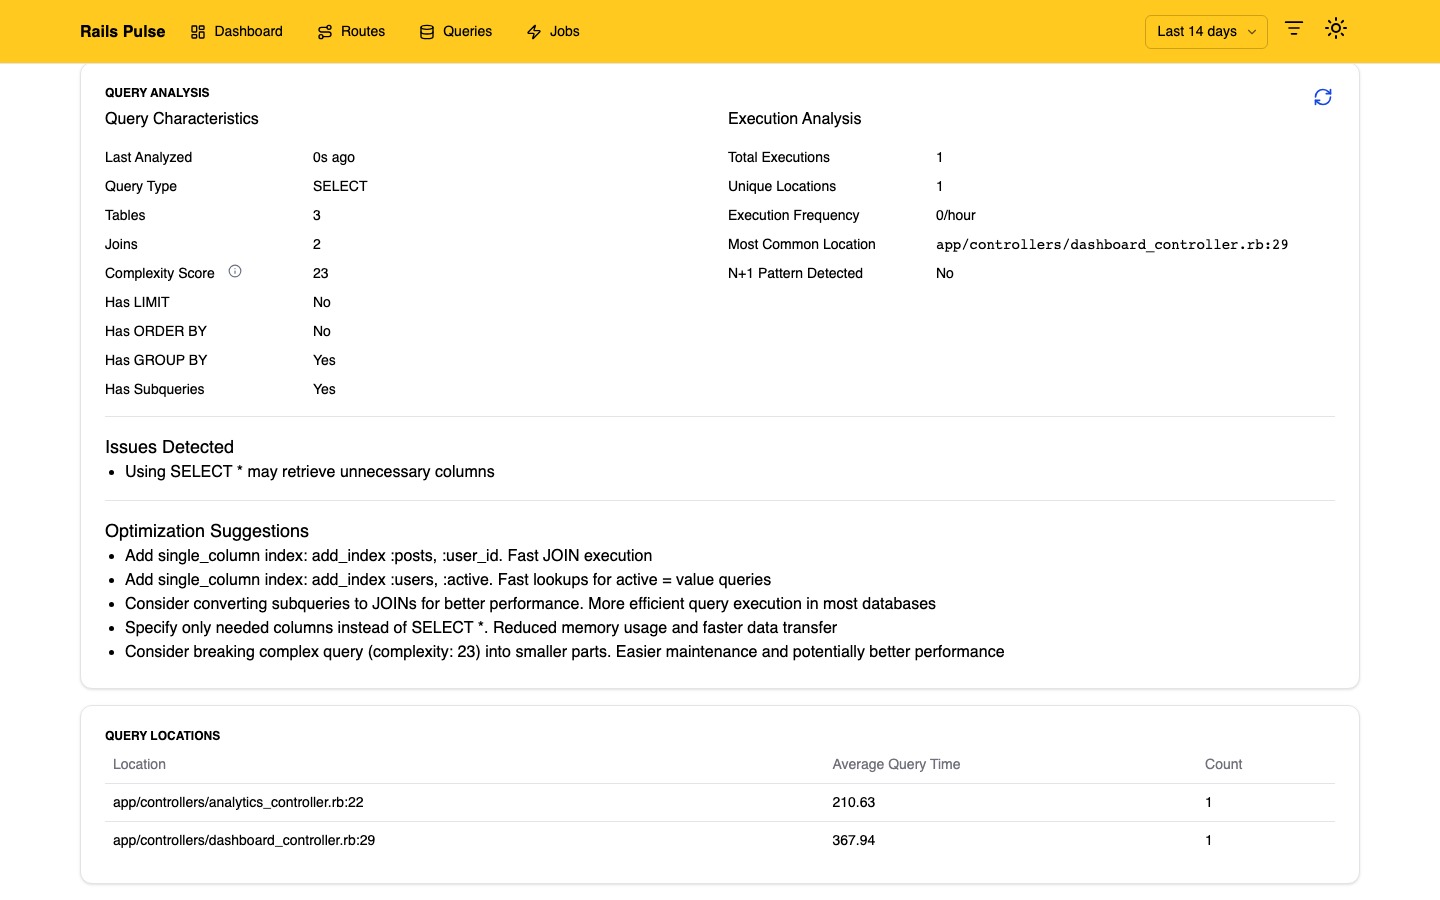
Query Detail
See the full history of any SQL query — execution frequency, average and P95/P99 times, which requests triggered it, and a zoomable performance chart over time.
Works with your stack.
Rails Pulse integrates with the tools and databases you're already using.
Databases
SQLite, PostgreSQL, and MySQL. Store Rails Pulse data in your main application database or a dedicated separate database.
Job Adapters
Sidekiq, Solid Queue, Good Job, Delayed Job, Resque, and any other ActiveJob adapter, all supported out of the box.
Rails & Ruby
Rails 7.2+ and Ruby 3.2+. Tested across Rails 7.2, 8.0, and 8.1 on each release.
Built for Developers
Rails Pulse is designed with developer experience in mind. Everything you need to monitor, debug, and optimize your Rails application.
Quick Installation
Add Rails Pulse to your application in minutes. Simply add the gem, run the installer, and you're ready to start monitoring.
Get Started in Minutes
Add Rails Pulse to your Gemfile, run the installer, and mount the engine. That's it. Start monitoring your application's performance immediately with zero configuration.
# Gemfile
gem 'rails_pulse'

# Install
$ bundle install
$ rails generate rails_pulse:install
$ rails db:migrate

# config/routes.rb
Rails.application.routes.draw do
  mount RailsPulse::Engine => "/rails_pulse"
end
Frequently Asked Questions
Everything you need to know about Rails Pulse
Can my AI coding agent read Rails Pulse data?
Yes. Rails Pulse includes an MCP server for Claude Code, Codex, Cursor and other MCP clients, plus a rails-pulse CLI and a JSON API. An agent can find the slowest endpoints since a deploy, the queries behind them, failing jobs, and recurring exceptions. Everything it can call is read-only. See Coding Agents.
How much does Rails Pulse cost?
Rails Pulse is open source and MIT licensed. Add it to your Gemfile and start using it with no account, no API keys, and no subscription required.
Where does my performance data get stored?
All data is stored in your own database, the same one your app uses, or a separate dedicated database if you prefer. Nothing is sent to any external service. Rails Pulse makes no outbound network connections. Your data is as private as the rest of your application.
Can I query the Rails Pulse data directly?
Yes. Because Rails Pulse stores data in your own database using standard ActiveRecord models, you can query it with SQL, join it against your own tables, export it to a BI tool, or build custom reports and alerts on top. You're not locked into the dashboard UI. The data is just tables in your database.
What Rails and Ruby versions are supported?
Rails Pulse supports Rails 7.2+ and Ruby 3.2+. It's built as a Rails Engine and follows Rails best practices, ensuring compatibility with the latest Rails versions.
Does Rails Pulse impact my application's performance?
Tracking data is written on a background thread after the response is sent, so the request thread pays well under a millisecond. The database writes themselves take a few milliseconds per request off the request path. For high-traffic applications you can reduce this further by filtering low-value routes (health checks, assets) or using a separate database.
Can I use a separate database for Rails Pulse?
Yes. Rails Pulse supports two database configurations:
- Single Database (default): Stores data in your main application database. Simple setup with zero additional configuration.
- Separate Database: Use a dedicated database for complete isolation. Supports SQLite, PostgreSQL, and MySQL.
Install with the --database=separate flag to use a separate database.
How does data cleanup work?
Rails Pulse offers automatic data archiving with two strategies: time-based cleanup (delete records older than a configured period) and count-based cleanup (enforce maximum record limits per table). Schedule RailsPulse::CleanupJob to run daily, or trigger it manually with rails rails_pulse:cleanup.
How do I secure the Rails Pulse dashboard?
Authentication is on by default outside development and test. Set config.authorize to a predicate such as ->(controller) { controller.current_user&.admin? } and anything that doesn't return true gets a 403. If you'd rather redirect to a login page, use authentication_method. It works with Devise, Rails 8 authentication, or anything else.
Does Rails Pulse track errors too?
Yes. Rails Pulse captures unhandled exceptions from requests and background jobs, groups them by class and location, and shows backtraces with source context and filtered request params. Messages are redacted using your app's filter_parameters before they're stored. There's no alerting or issue-tracker integration; what you get is recurring production errors alongside your performance data, in your own database. It's opt-in with config.track_exceptions = true.
From the blog
Practical writing on Rails performance, monitoring, and building in public.